More and more fire and gas professionals are asking about the benefit of using scenario coverage over geographic coverage. They see that the amount of effort required to perform a scenario coverage mapping project is significantly increased so they desire to see evidence that the additional effort is worth it. Well, it is worth the additional effort. The reason – significantly lower CAPEX (capital expenditures) and OPEX (operating expenditures). In order to demonstrate the benefit, we have prepared an example of analyzing the same facility both ways to show how the designs will differ. We at Kenexis are prepared to show this type of analysis because we perform hundreds of similar studies each year, and know what different results can be achieved using the different methods. Furthermore, since our software does both methods simultaneously, we can easily compare them.
Consider a typical process facility. In this case, a section of a Diesel Hydrotreating Unit in a refinery. While we would never display customer results, we have prepared results for a facility that would be very similar to the dozens that we have already analyzed. Since this is an example, there is no specific plot plan to work from, but the figures below show the detector layout views, and graded area views at the elevation of interest for gas detection, which in this case is 3 meters (i.e,, the elevation where the gas detectors are located. The detector layout view shows where the equipment items are located, and where in relation to those equipment items the detectors are located. The grading layout shows where gas detection is required for geographic coverage techniques. Grade B (darker orange) requires 80% coverage while Grade C (lighter orange) requires 60%.
As can be seen in the figure above, using scenario coverage, six (6) detectors were required to achieve adequate coverage of this area for combustible gas detection. The results of the scenario coverage mapping in terms of scenario geographic risk and mitigated risk are shown in the figures below. As can be seen in the graphics, the achieved scenario coverage is 85.5%, slightly in excess of the 80% target.
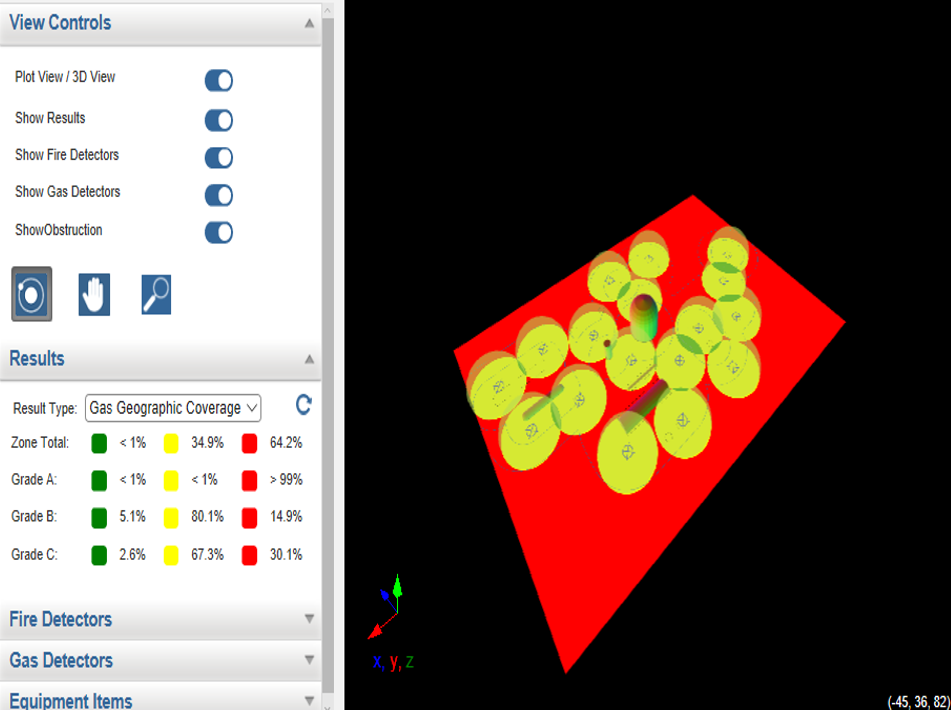
Since Effigy™ automatically calculates the geographic coverage results for automatically, an Effigy™ user can view the results that would have been achieved using geographic coverage, as shown in the figure below. Coverage was based on the standard assumption of a 5-meter diameter gas cloud being the design basis.
In this case, the Grade B areas achieved a coverage of 25.8% and Grade C areas achieved a coverage of 22.6%, both very much short of their selected performance targets. Why is the coverage so low, because geographic coverage doesn’t consider the actual size of the gas cloud, the effect of wind directions, or the locations where gases are released from (and where they’re not). Those of you who understand oil refineries know that hydrotreater units operate under very high pressures, and as a result even pinhole leaks end up being substantially large. This effect can readily be modeled in scenario coverage, but not geographic coverage. In order to achieve the selected coverage targets using geographic coverage, more detectors were required to be added, as shown below.
In order to achieve coverage targets an additional 11 detectors were required (17 total). This resulted in a Grade B area coverage of 85% and a Grade C coverage of 69%. For purposes of argument, let’s assume that an equivalent degree of coverage could have been obtained using 10 new detectors.
The difference in using geographic coverage in this area of the plant was an increase in the number of detectors by 267%. Assuming an “installed” cost of $10,000 per detector, this section of the plant had an increased CAPEX for additional gas detectors of $100,000. Assuming that detectors are calibrated annually, and require 2 man-hours per calibration at a cost of $100 per hour, the additional operating costs (not including consumables like calibration gas, is $2,000 per year, and this cost will recur every year for the life of the facility. Since the zone that was analyzed in this example is only one of four zones for the entire unit, the savings for using scenario coverage for the entire unit (CAPEX and OPEX) approaches $0.5 million. If one considers every unit in a facility, the cost savings can be millions of dollars. When compared to a few extra tens of thousands of dollars in analysis work to save hundreds of thousands of dollars in CAPEX and OPEX, use of scenario coverage is almost always a wise choice.


