Quantitative Bowtie Analysis
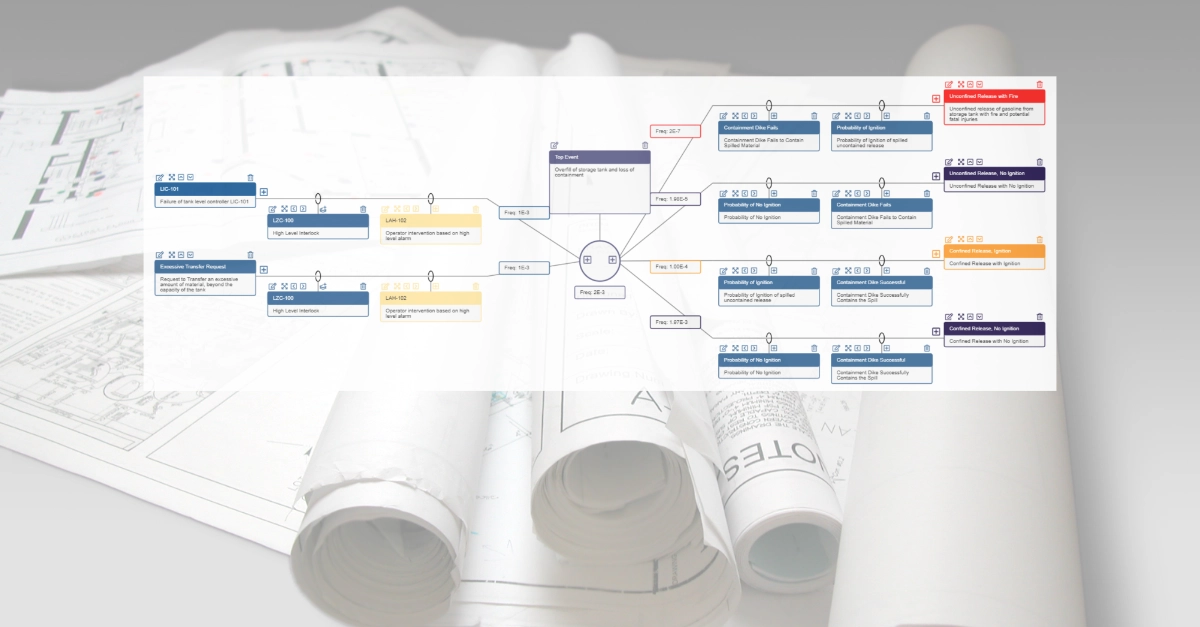
Bowtie diagrams are a valuable tool for understanding and visualizing risk management, but their traditional qualitative approach has its limits. While they effectively show how threats, barriers, and consequences are interrelated, they often fall short when it comes to providing the details needed for more informed decision-making. That’s where quantitative bowtie analysis comes in.
In this webinar, we explore how quantitative analysis enhances bowtie methodology by incorporating numerical values for the probabilities and frequencies of threats and consequences. This deeper layer of insight helps us move beyond general visualizations to a more precise, data-driven understanding of risk.
You’ll learn how to:
- Calculate the frequency of threats and assess their potential impact.
- Evaluate the likelihood of the top event occurring, helping prioritize risk management efforts.
- Quantify the frequency of consequences to better understand the full range of potential outcomes.
With quantitative bowtie analysis, you can approach risk management with greater confidence, applying a structured and analytical process to reduce uncertainty and improve decision-making.
Don’t miss this opportunity to learn how to take your risk management practices to the next level.
This webinar is part of Kenexis’ ongoing commitment to providing the industry with the tools and knowledge needed to ensure the highest standards of safety and compliance.

